As a data scientist, evaluating the performance of machine learning models is a crucial step in the model development process. Model performance evaluation is vital in ensuring that the model can accurately predict outcomes on new data.
Table of Contents
Evaluating the Performance of Machine Learning Models
This article will discuss the importance of metrics in machine learning, the different types of metrics used in machine learning, and specific metrics used in training, classification, regression, clustering, and interpretability.
Importance of Metrics in Machine Learning
Metrics are used to measure the performance of a machine learning model. They help in determining whether the model is making accurate predictions, and if not, which areas need improvement. Metrics also assist in comparing different models, choosing the best model for a particular problem, and fine-tuning the model to achieve better performance.
Choosing the right metric is crucial in evaluating model performance. Some metrics work better for certain problems, while others are unsuitable. Therefore, it’s essential to understand the different types of metrics in machine learning.
Types of Metrics in Machine Learning
There are three types of metrics in machine learning: objective metrics, subjective metrics, and effectiveness metrics.
- Objective Metrics – Objective metrics are quantitative measures that assess how well the model performs on a specific task. These metrics are easy to interpret and widely used in machine learning. Examples of objective metrics include accuracy, loss, and learning rate.
- Subjective Metrics – Subjective metrics are qualitative measures that assess the model’s performance based on the user’s perception. These metrics are subjective and vary depending on the user’s preferences. Examples of subjective metrics include ease of use, user satisfaction, and visual appeal.
- Effectiveness Metrics – Effectiveness metrics evaluate how well the model achieves the desired outcome. These metrics are used to assess the model’s impact on the overall business or research problem. Examples of effectiveness metrics include customer satisfaction, revenue generated, and research impact.
Training Metrics
Training metrics are used to evaluate the performance of the model during the training phase. These metrics help in understanding how well the model is learning from the data and whether adjustments need to be made to the training process.
- Accuracy – Accuracy measures the percentage of correctly predicted outcomes. It is one of the most commonly used metrics in machine learning. However, accuracy can be misleading in cases where the data is imbalanced or when the cost of false positives and false negatives is different.
- Loss – Loss measures the error between the predicted and actual values. It is used to optimize the model during training by adjusting the weights and biases to reduce the loss. Common loss functions include mean squared error and cross-entropy loss.
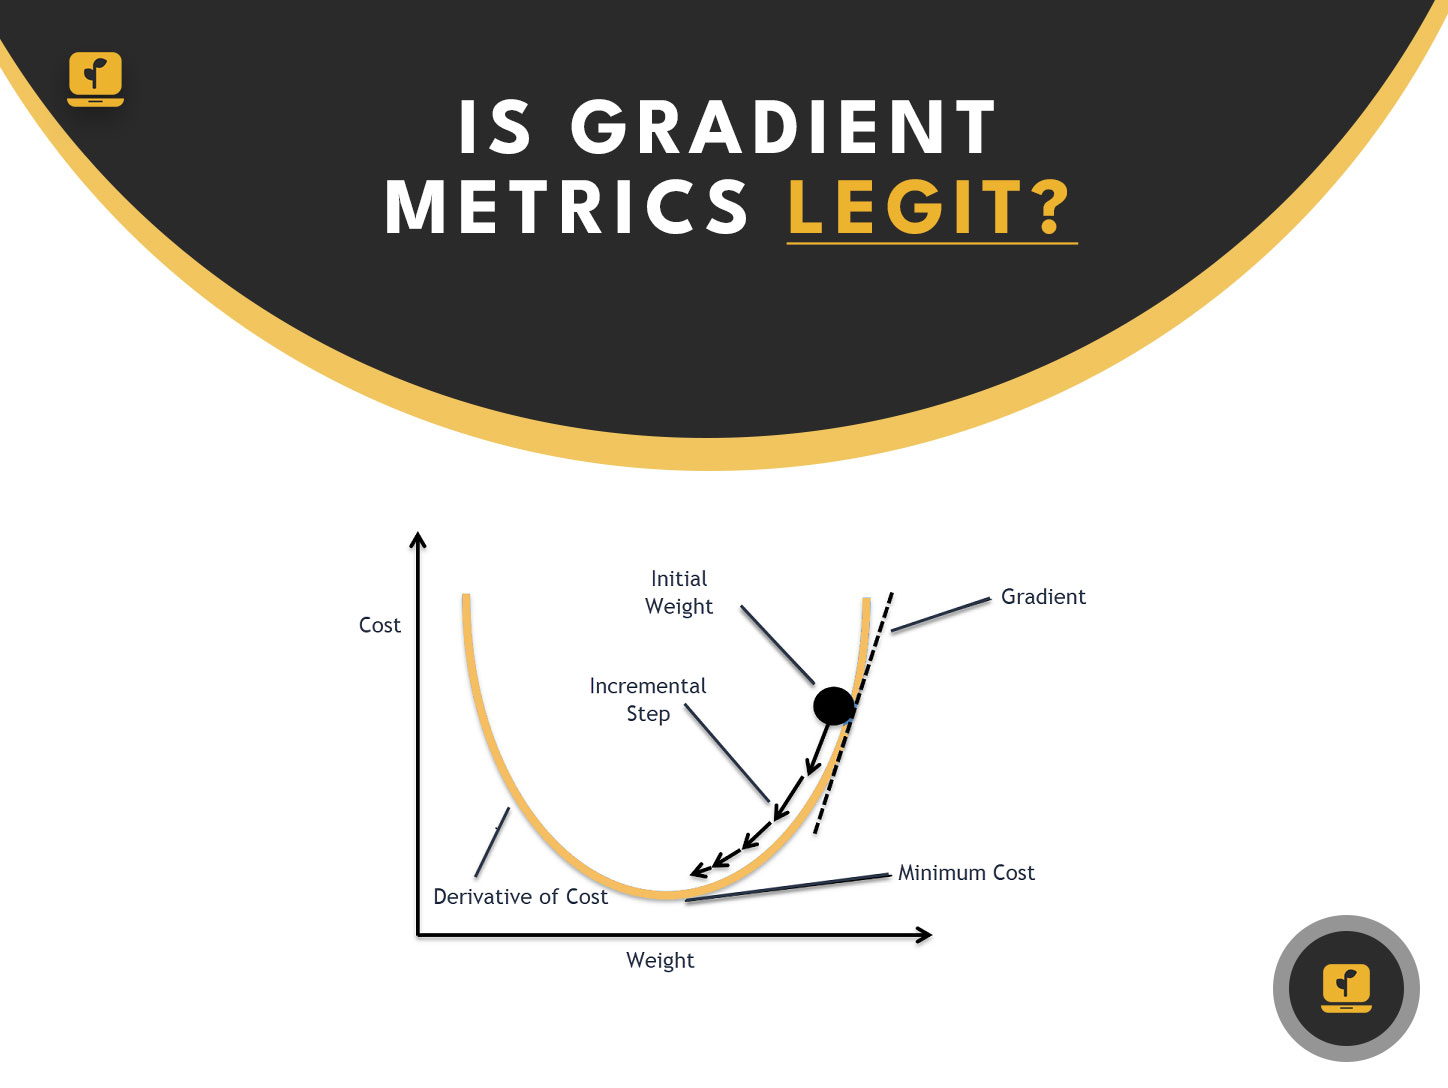
- Learning Rate – The learning rate determines the step size of the gradient descent algorithm during training. It controls how quickly the model learns from the data. A high learning rate can lead to overshooting the optimal solution, while a low learning rate can result in a slow convergence.
Classification Metrics
Classification metrics are used to evaluate the performance of models that predict categorical outcomes. These metrics help in understanding how well the model is identifying the different classes and whether adjustments need to be made to improve the performance.
- Precision – Precision measures the percentage of correctly predicted positive outcomes out of all predicted positive outcomes. It is used to evaluate how well the model is identifying the positive class.
- Recall – Recall measures the percentage of correctly predicted positive outcomes out of all actual positive outcomes. It is used to evaluate how well the model is capturing all positive cases.
- F1 Score – F1 Score is the harmonic mean of precision and recall. It is used to balance the trade-off between precision and recall. A high F1 score indicates that the model is performing well in both precision and recall.
- ROC Curve – The Receiver Operating Characteristic (ROC) curve is a graphical representation of the trade-off between the true positive rate and the false positive rate. It helps in understanding how well the model is distinguishing between the positive and negative classes.
Regression Metrics
Regression metrics are used to evaluate the performance of models that predict continuous outcomes. These metrics help in understanding how well the model is predicting the continuous variable and whether adjustments need to be made to improve the performance.
- Mean Squared Error – Mean Squared Error (MSE) measures the average squared difference between the predicted and actual values. It is commonly used in linear regression and penalizes large prediction errors.
- Mean Absolute Error – Mean Absolute Error (MAE) measures the average absolute difference between the predicted and actual values. It is less sensitive to outliers than MSE and provides a better understanding of the average prediction error.
- R-Squared – R-Squared measures the proportion of variance in the dependent variable that is explained by the independent variables. It provides a measure of how well the model fits the data.
Clustering Metrics
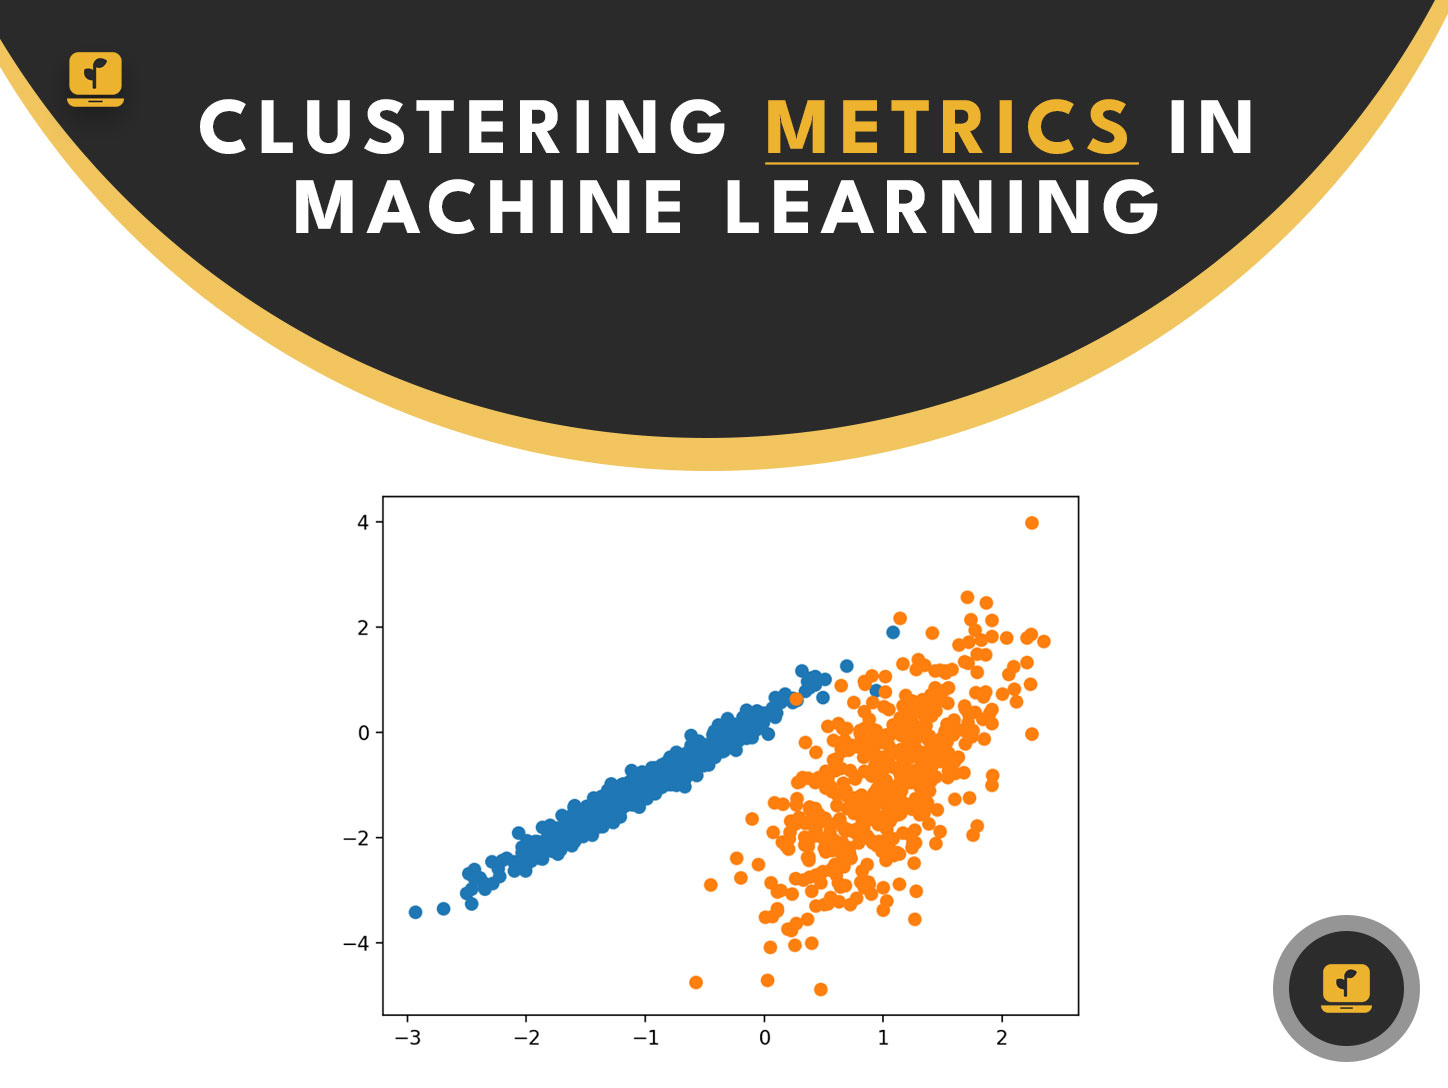
Clustering metrics are used to evaluate the performance of models that group similar data points together. These metrics help in understanding how well the model is identifying the underlying patterns in the data.
- Silhouette Score – Silhouette Score measures how well each data point fits into its assigned cluster. It ranges from -1 to 1, where a score of 1 indicates that the data point is well-matched to its cluster, and a score of -1 indicates that the data point would fit better in another cluster.
- Davies-Bouldin Index – Davies-Bouldin Index measures the average similarity between each cluster and its most similar cluster. It provides an overall measure of how well the clusters are separated.
- Calinski-Harabasz Index – Calinski-Harabasz Index measures the ratio of between-cluster variance to within-cluster variance. It provides a measure of how well the clusters are separated and compact.
Interpretability Metrics
Interpretability metrics are used to evaluate how well the model can be understood and explained. These metrics help in understanding how the model is making predictions and whether adjustments need to be made to improve interpretability.
- Feature Importance – Feature Importance measures how much each feature contributes to the model’s predictions. It helps in understanding which features are the most important in making predictions.
- Partial Dependence Plot – Partial Dependence Plot shows the relationship between a feature and the model’s predictions, while holding all other features constant. It helps in understanding how each feature affects the model’s predictions.
- SHAP Values – SHAP (SHapley Additive exPlanations) Values measure the contribution of each feature to the prediction for a particular data point. It helps in understanding which features are the most important for a specific prediction.
Is Gradient Metrics Legit?
Gradient Metrics is a tool for evaluating machine learning models that claims to provide a comprehensive assessment of model performance. However, there is no consensus on its effectiveness, and its claims have been met with skepticism.
While Gradient Metrics may provide useful insights, it is essential to evaluate its results critically and not rely solely on its assessments. It’s crucial to consider other metrics and use domain knowledge to evaluate the model’s performance.
Conclusion – Choosing the Right Metrics for Evaluating Machine Learning Models
Evaluating the performance of machine learning models is crucial in ensuring that the model can accurately predict outcomes on new data. Choosing the right metric is essential in evaluating the model’s performance. There are different types of metrics in machine learning, including objective metrics, subjective metrics, and effectiveness metrics.
Specific metrics are used in training, classification, regression, clustering, and interpretability. Each of these metrics provides a unique perspective on the model’s performance and helps in identifying areas for improvement.
It’s crucial to choose the right metrics for a particular problem and evaluate the model’s performance critically. While tools like Gradient Metrics may provide useful insights, they should be evaluated critically and not relied on solely.
By understanding the different metrics used in machine learning, data scientists can evaluate the performance of their models effectively and make informed decisions on model development and fine-tuning.


